فصل 12 نمودار
برای رسم نمودار در R توابع زیادی وجود دارد که میتوانیم برای رسم مدلهای مختلف نمودار از آنها استفاده کنیم.
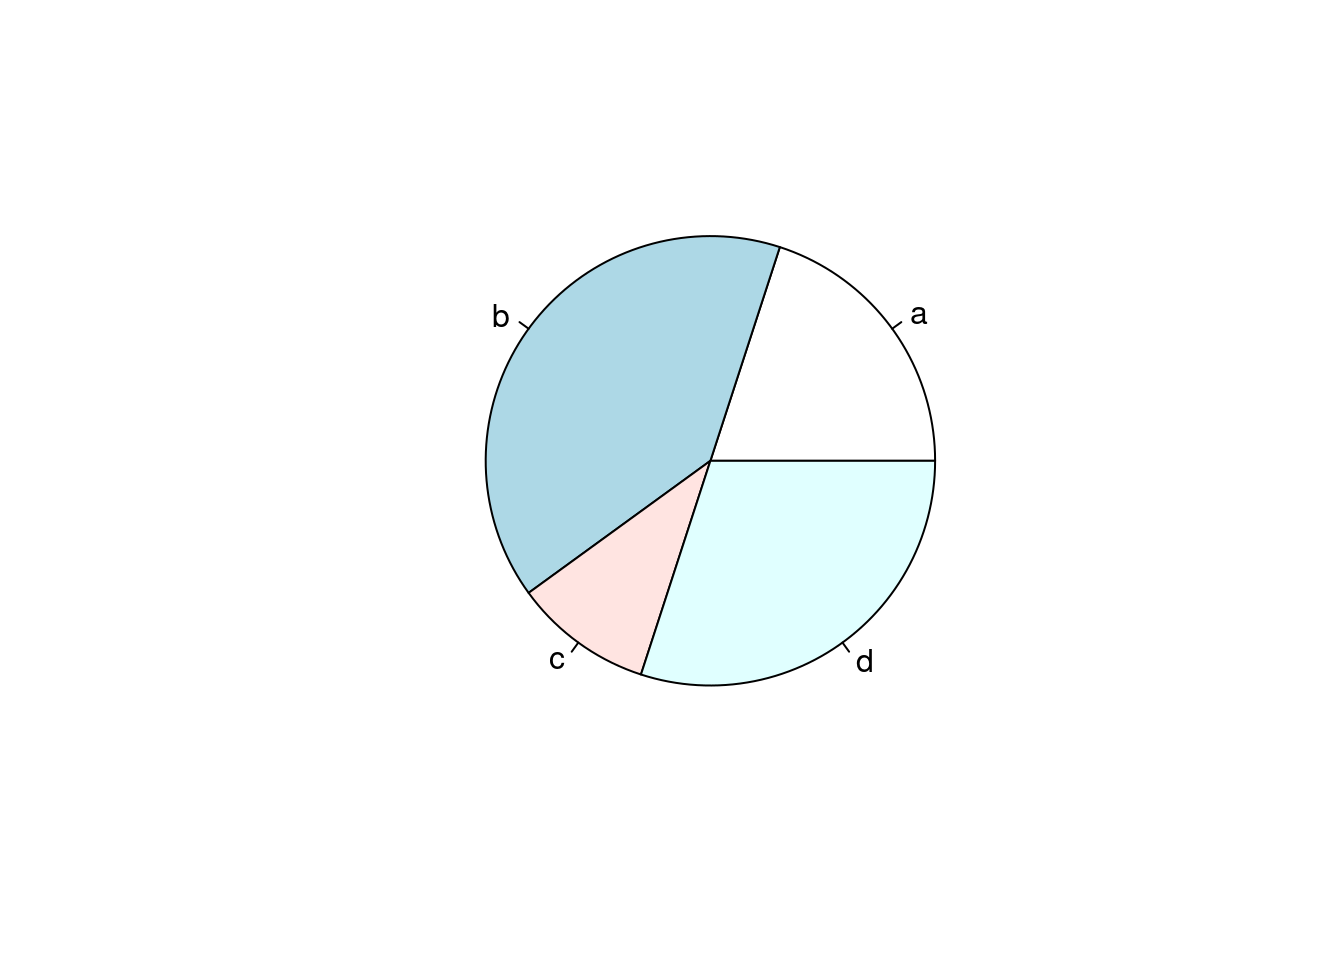
- نمودار دایرهای
- نمودار نواری
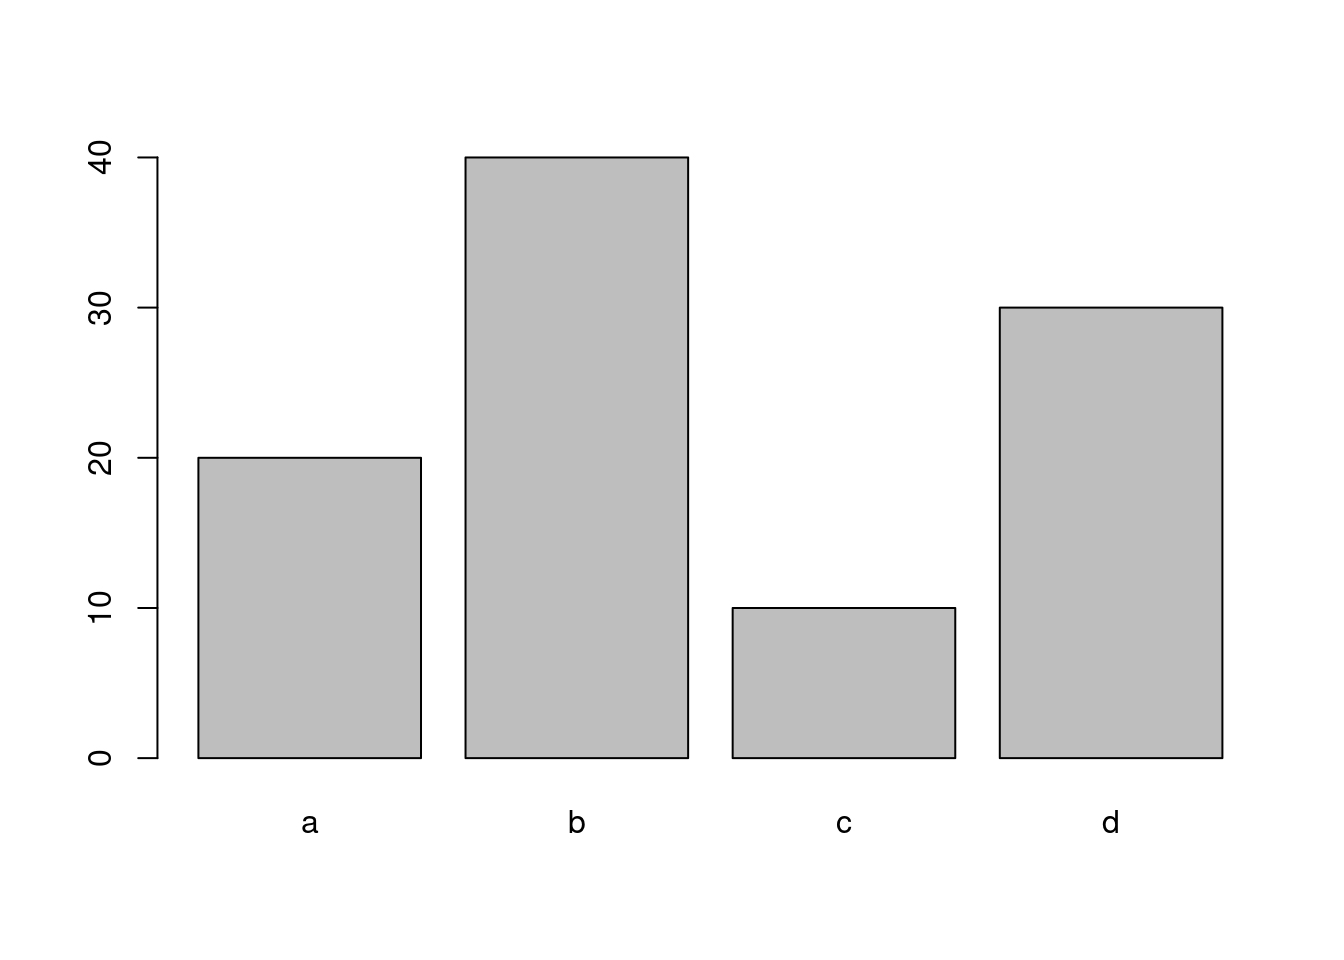
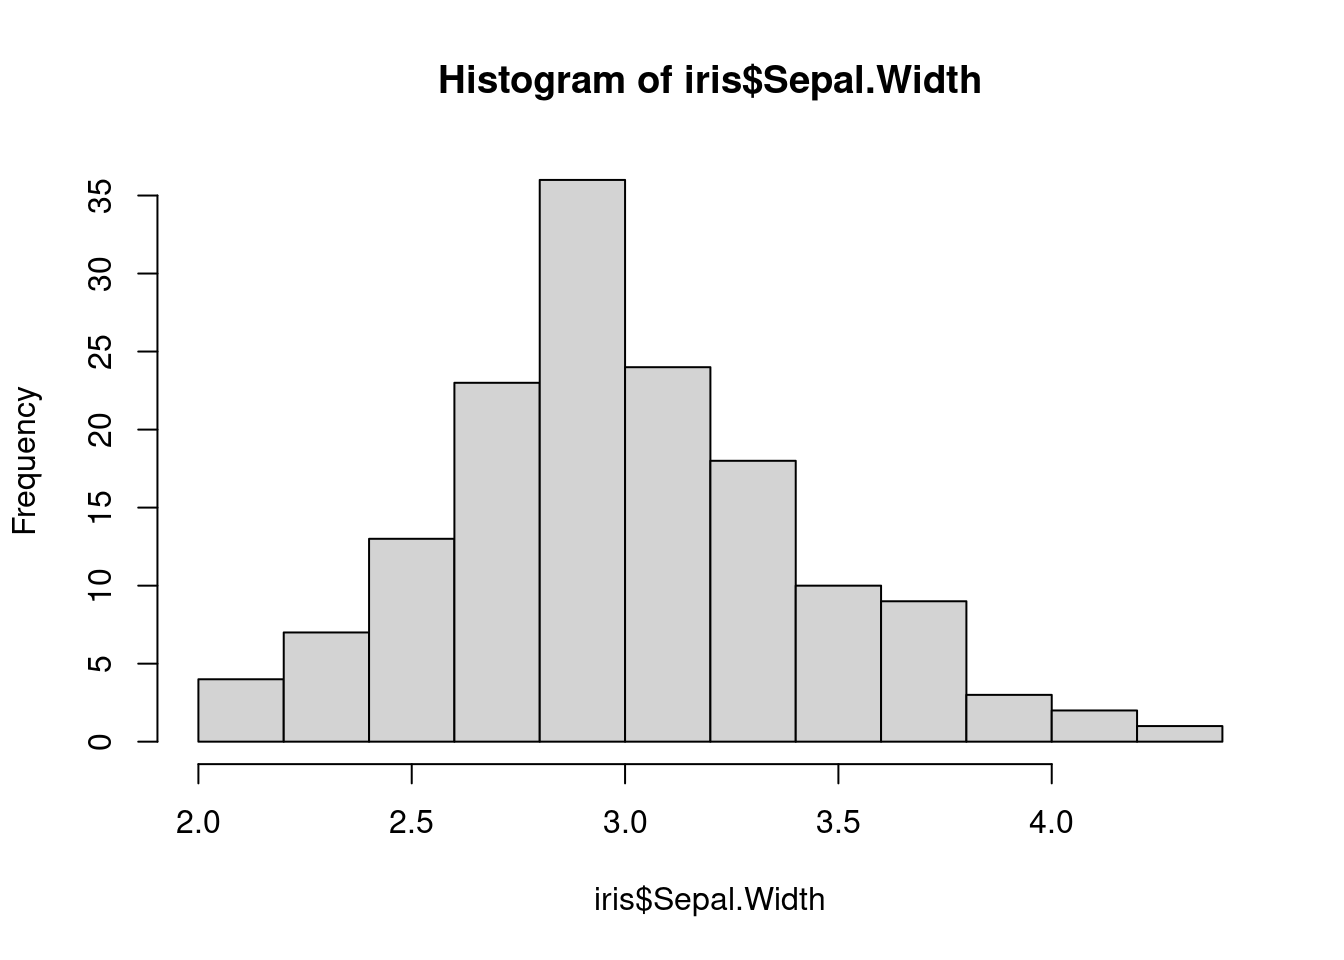
- نمودار ستونی یا بافت نگاشت
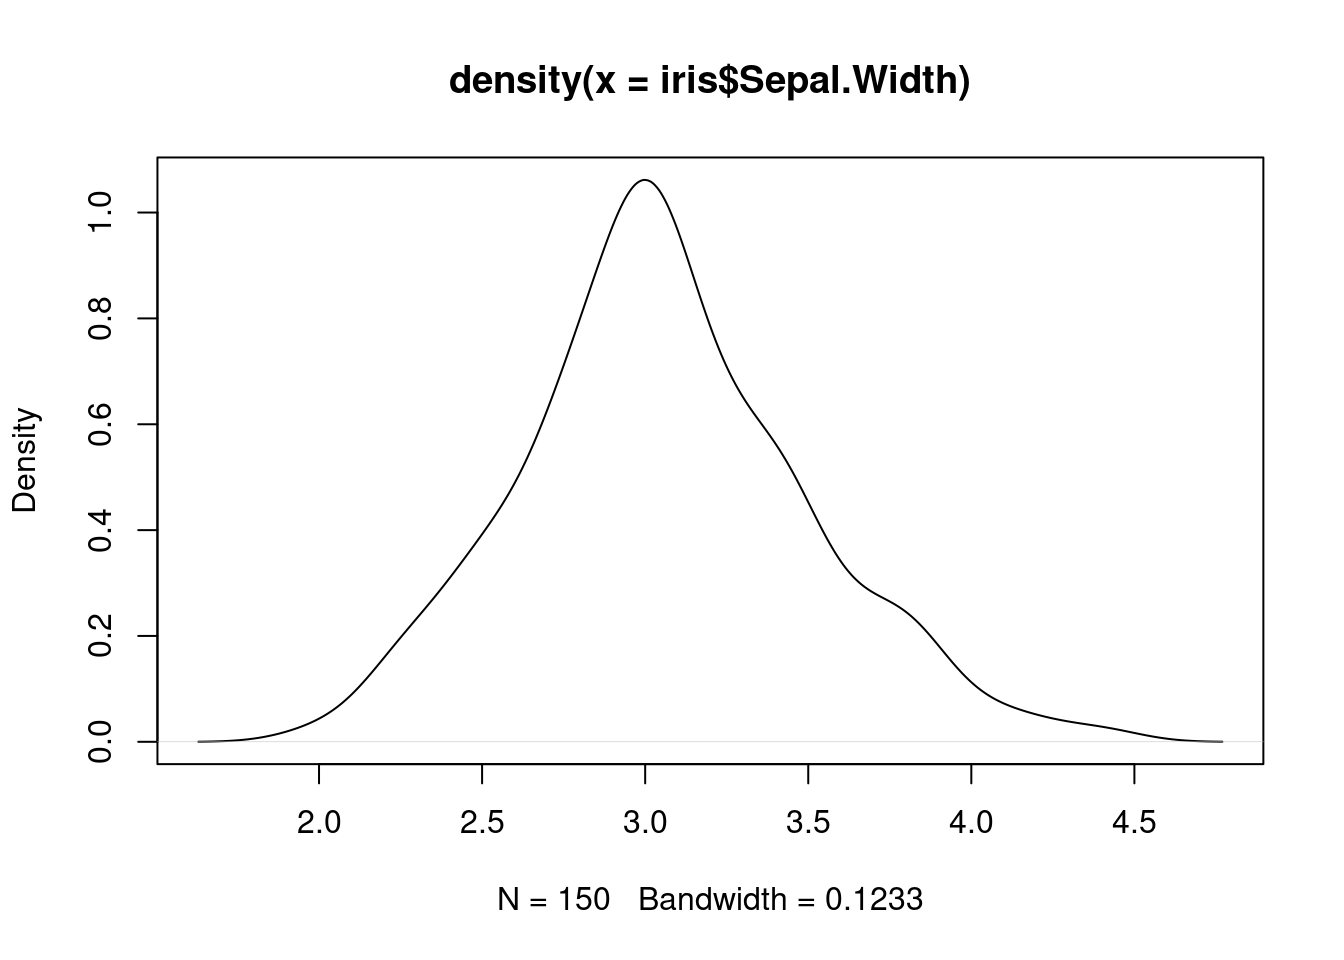
- نمودار چگالی
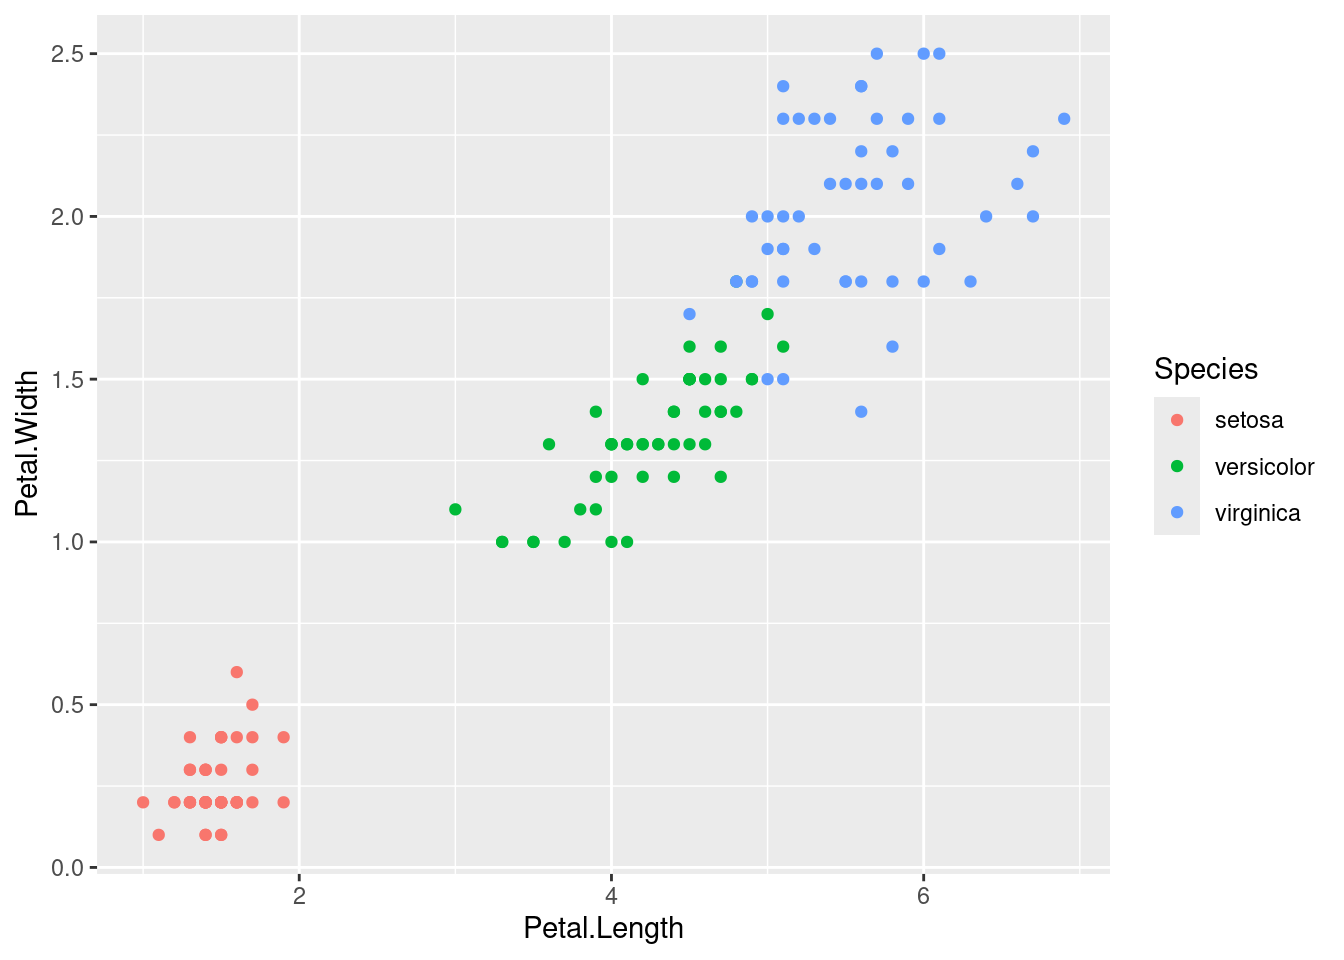
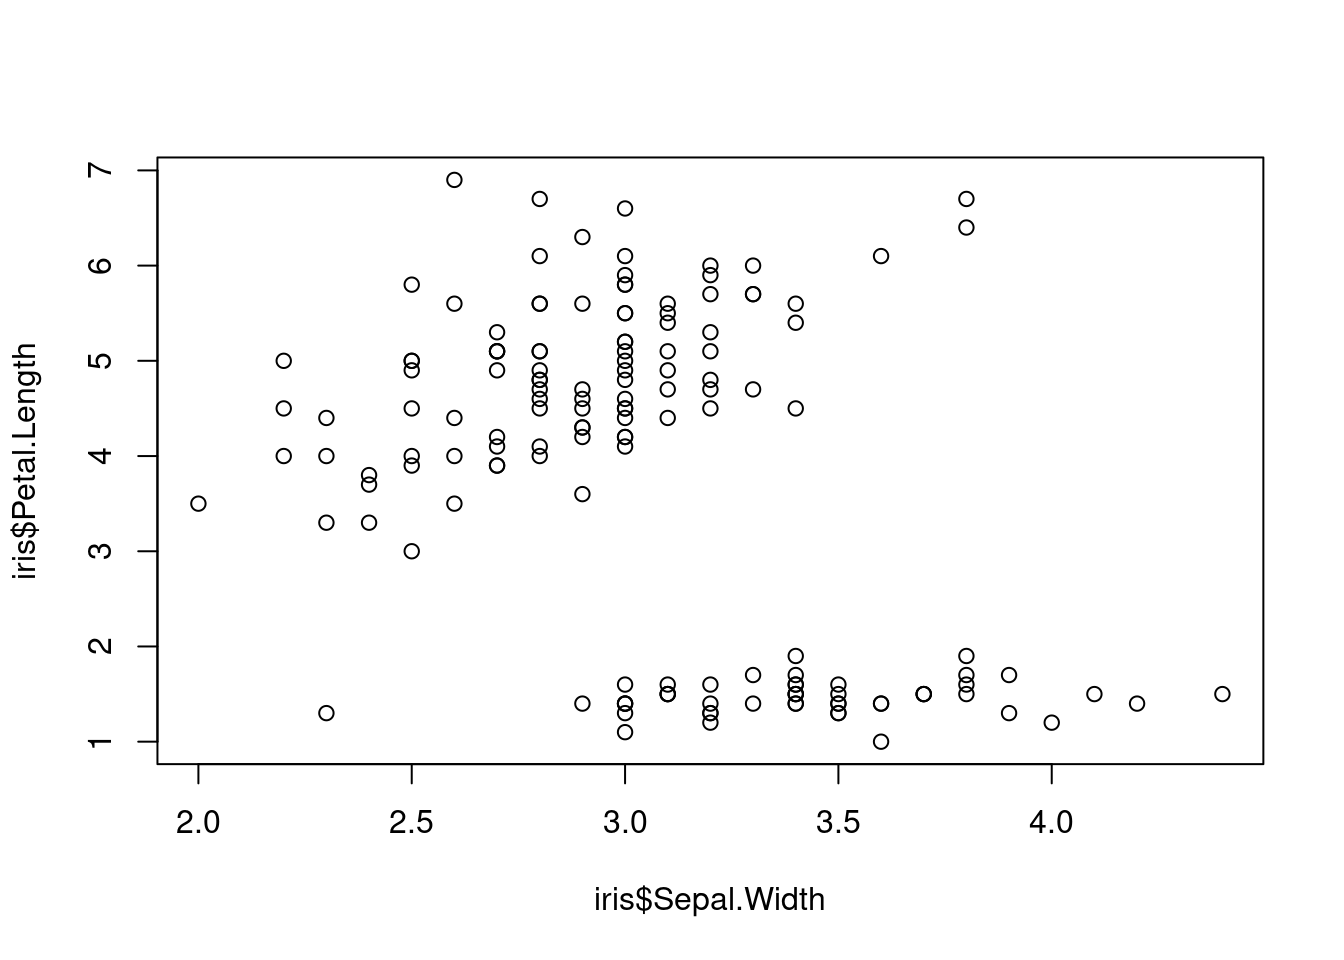
- نمودار پراکندگی
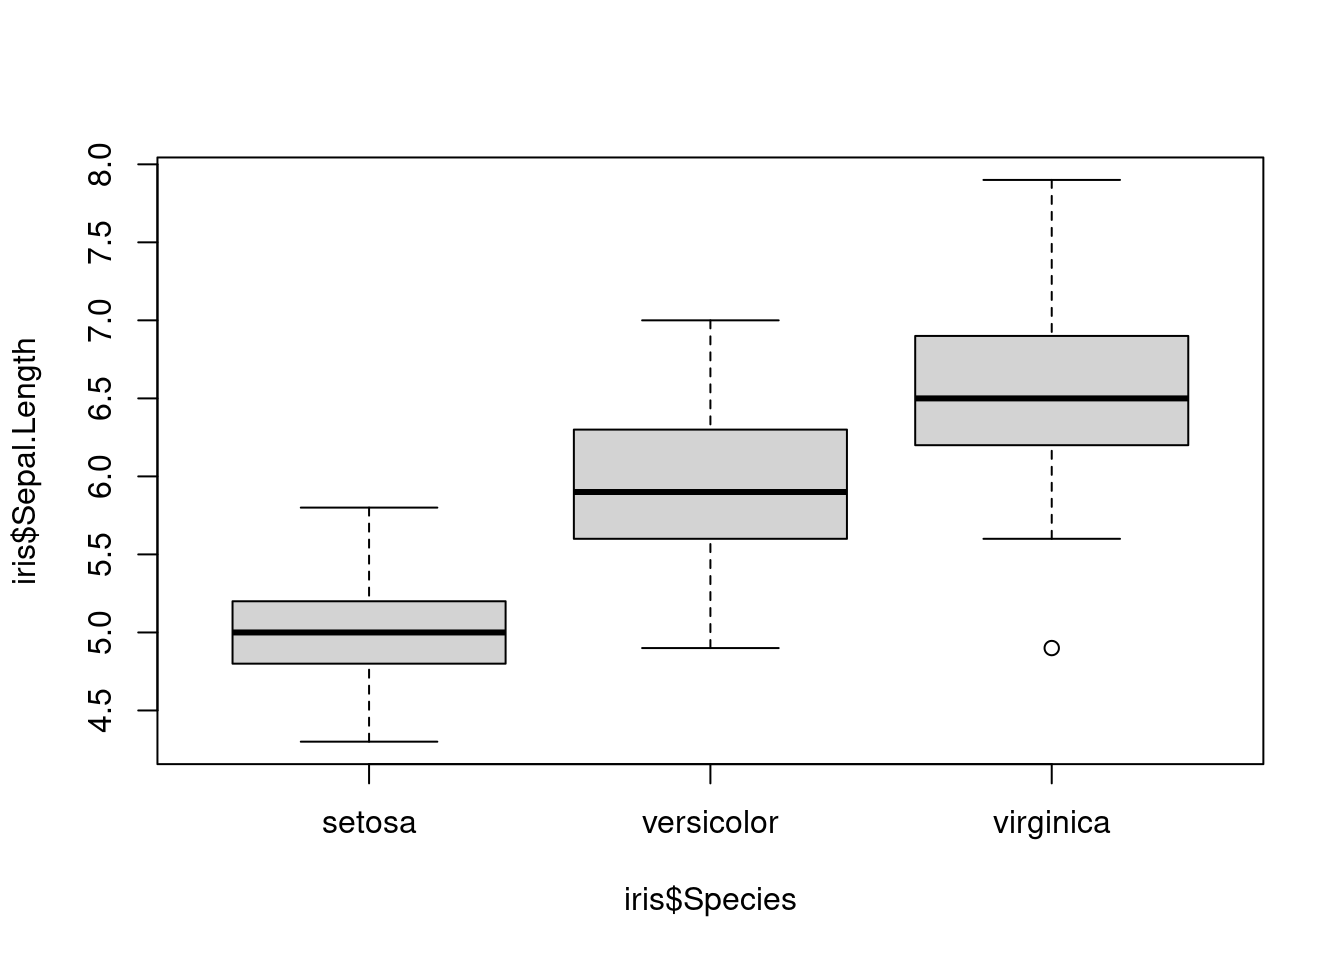
- نمودار جعبهای
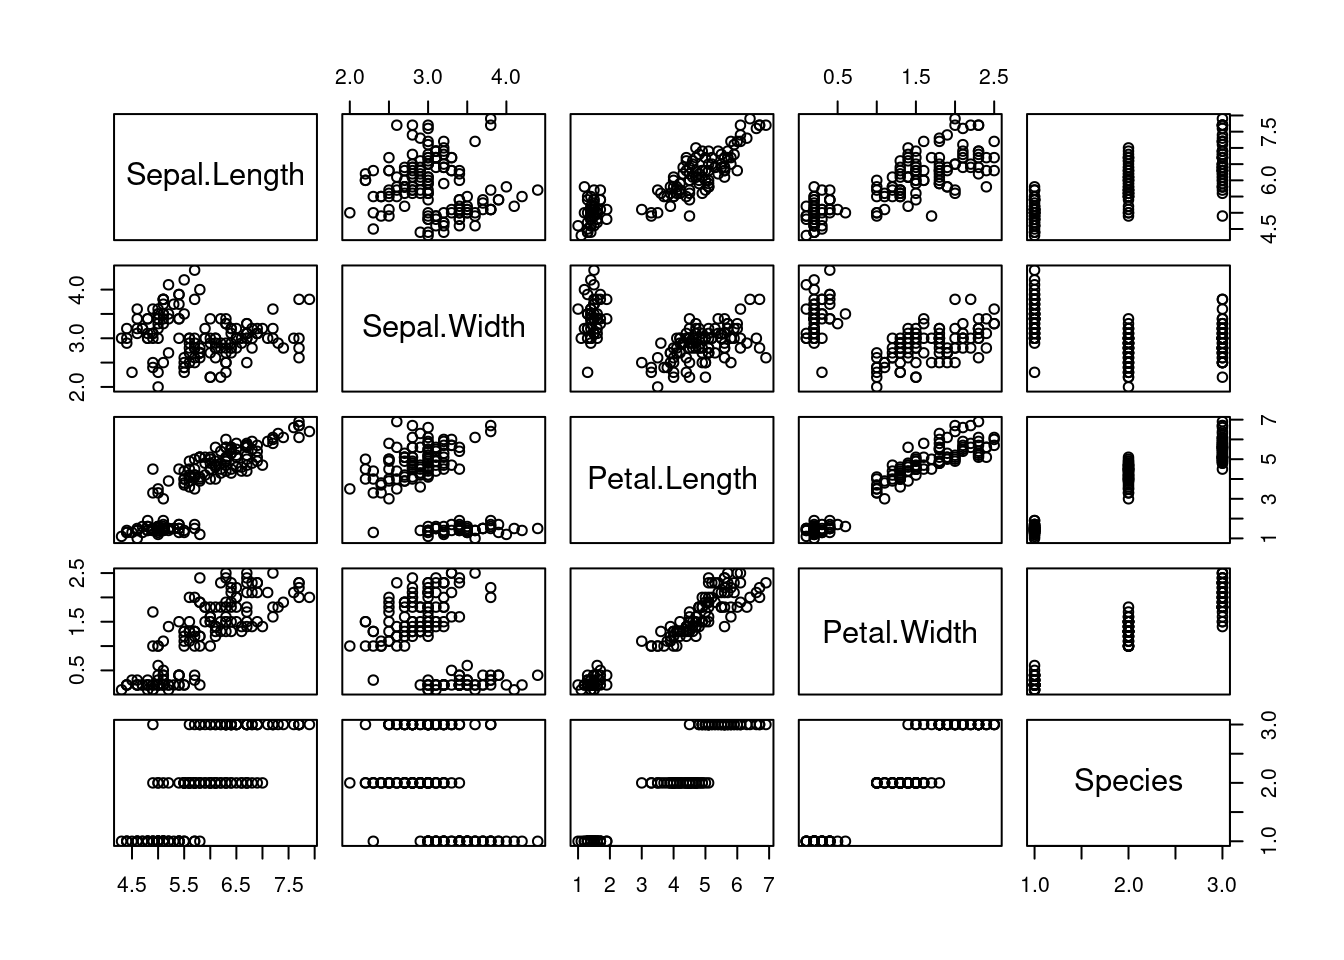
- رسم نمودار کلی از دادهها
- ذخیره نمودار در فرمتهای مختلف
Code
- ggplot2:
یکی از بهترین بستههای رسم نمودار، بسته
ggplot2است.
Code