Prisma Flowchart
Search strategy, database selection
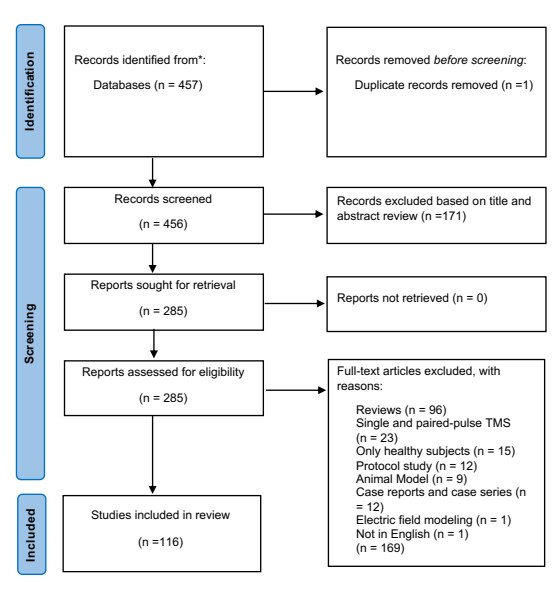
Figure 15: PRISMA flowcharts for TMS studies. PRISMA2020 flow diagram for published TMS trials in drug addiction from Jan 2000 to Jan 2023. Abbreviations: n, number of publications.
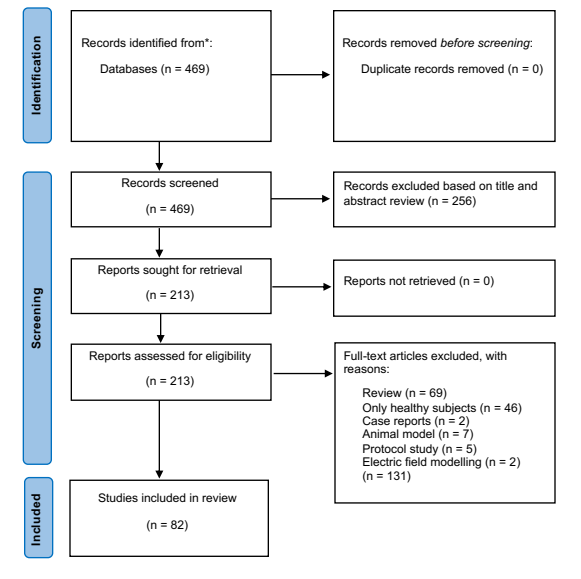
Figure 16: PRISMA flowcharts for tES studies. PRISMA2020 flow diagram for published tES trials in drug addiction from Jan 2000 to Jan 2023. Abbreviations: n, number of publications.
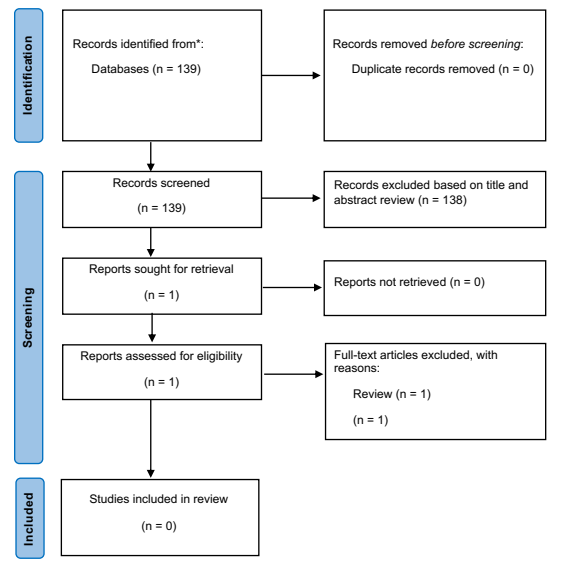
Figure 17: PRISMA flowcharts for TUS studies. PRISMA2020 flow diagram for published TUS trials in drug addiction from Jan 2000 to Jan 2023. Abbreviations: n, number of publications.